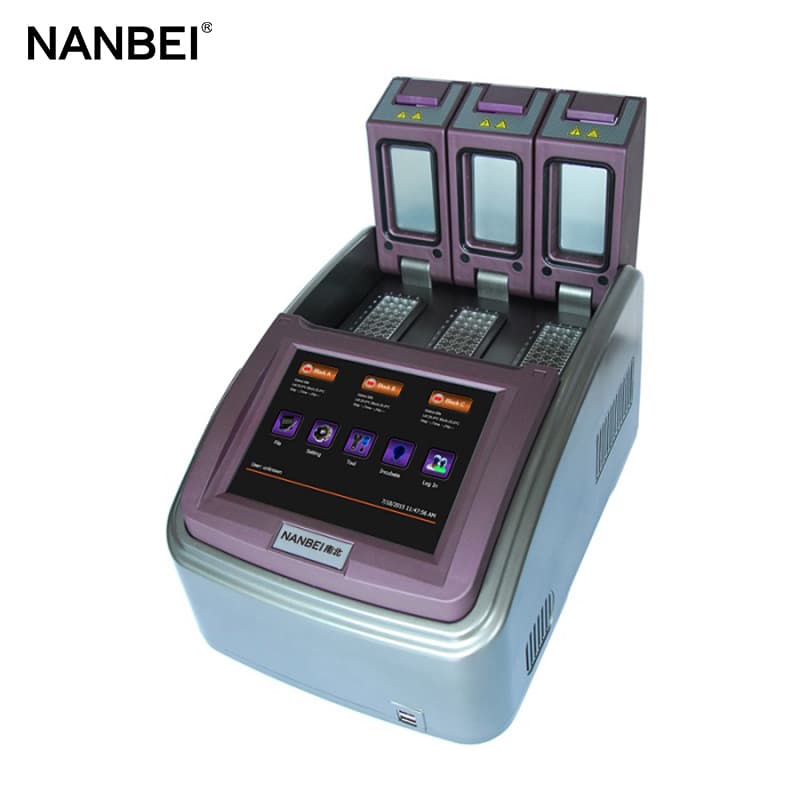
Real-time fluorescence quantitative PCR machine provides an efficient and accurate tool for DNA quantitative analysis by combining PCR technology and real-time fluorescence detection. Mastering the principles and operating steps of real-time fluorescence quantitative PCR can help researchers and clinicians obtain more accurate and reliable results in molecular biology research and diagnosis.

The following are the basic steps for using a real-time fluorescence quantitative PCR detector to conduct experiments:
Step 1: Sample preparation and DNA extraction
Extract DNA from the sample to be tested and ensure the purity and integrity.
Step 2: Reaction system preparation
Prepare the PCR reaction system, including the DNA sample to be amplified, primers, probes, DNA polymerase and PCR buffer. Adjust the concentration of each component according to experimental needs.
Step 3: Primer and probe design
Design primers and probes to ensure specificity and complementarity. Probes usually carry fluorescent labels and fluorescence quenchers.
Step 4: Load the sample
Load the reaction system into the real-time fluorescence quantitative PCR system, ensuring that each sample is correctly placed in the corresponding well position.
Step 5: Set experimental parameters
According to the design of primers and probes, set the temperature cycle parameters of the PCR machine, including denaturation, annealing and extension temperatures, as well as the timing of fluorescence signal detection.
Step 6: Run the PCR reaction
Start the PCR machine and start the cycle temperature program. Real-time fluorescence signals are detected and recorded after each cycle.
Step 7: Data Analysis
Based on the growth curve of the fluorescence signal, use the standard curve method to calculate the initial concentration of target DNA in the sample. Analyze results and record data.
Step 8: Interpretation of results
Interpret the amount of target DNA in the sample based on the experimental design and analysis results.
PCR Machine/Thermal Cycler
NANBEI INSTRUMENT LIMITED has been in the laboratory instrument construction industry for more than 20 years. This is a comprehensive factory dedicated to research, development and manufacturing. We are committed to providing customers with high-quality PCR machines, Real-time PCR, Thermal Cycler, Nucleic acid extractor.
QR Code
